

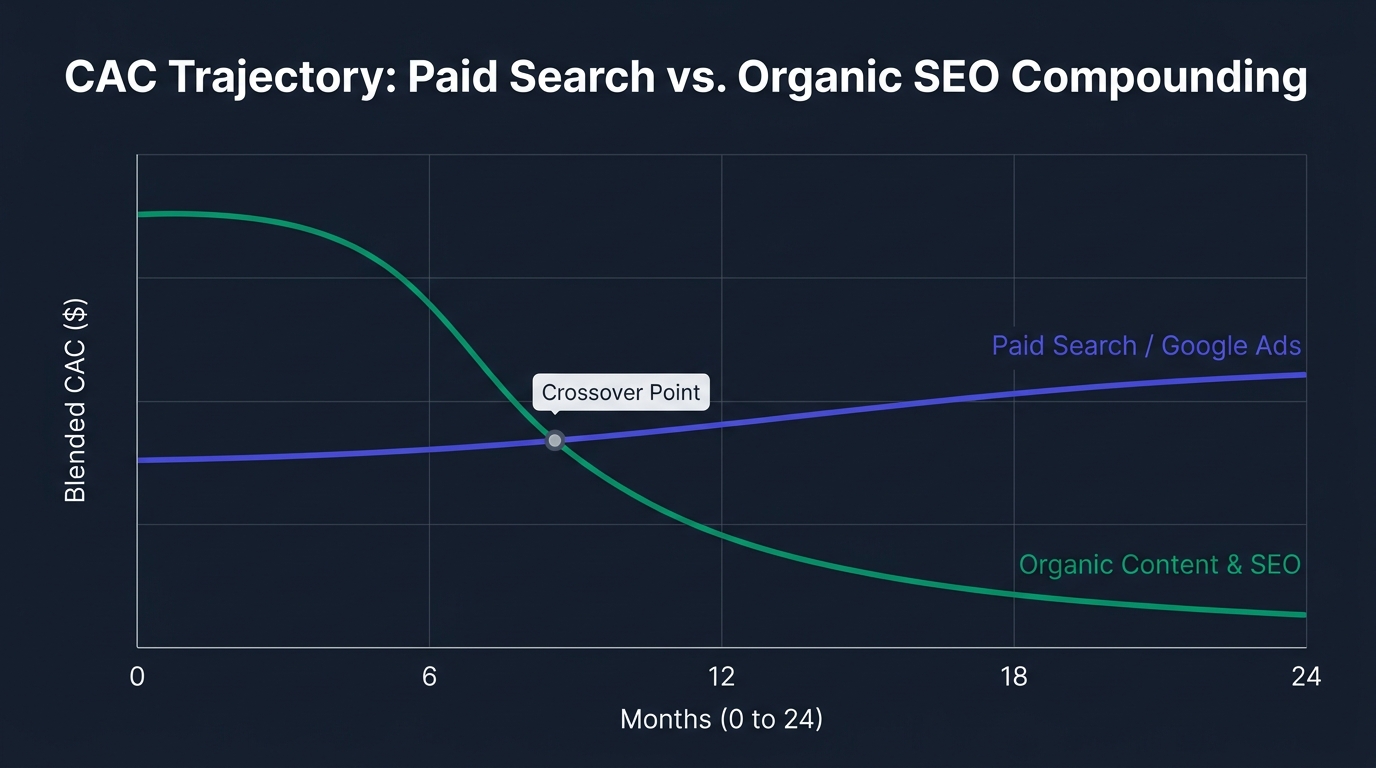
Why the Google Ads vs SEO Debate Changed in 2026
Marketing leaders evaluating growth channels in 2026 face two simultaneous structural pressures. In paid search auctions, commercial cost-per-click (CPC) rates across B2B software, legal, healthcare, home services, and agency categories have risen by an average of 19% year over year. High-intent comparison keywords routinely clear $45 to $65 per click in the United States.
At the same time, organic search has evolved beyond simple keyword matching into a multi-surface ecosystem encompassing Google Search, AI Overviews, and conversational answer engines. Recent empirical datasets published in IEEE DataPort (2026) demonstrate that businesses combining data-driven paid validation with long-tail organic content outperform single-channel advertisers in both lead quality and multi-year margin retention.
Understanding how to allocate budget between Google Ads, content marketing, web design performance, and conversion rate optimization requires looking past surface clicks to examine unit economics across a 24-month timeline.
Side-by-Side Channel Benchmark Comparison (2026 Cohort Data)
Before committing capital to either channel, decision-makers need a realistic baseline of how paid search auctions compare against organic content and SEO across speed, cost structure, buyer trust, and compounding durability.
| Performance Dimension | Google Ads (Paid Search & PMax) | Content Marketing & Organic SEO |
|---|---|---|
| Time to Initial Qualified Leads | 24 to 72 hours after campaign launch | 3 to 6 months for long-tail clusters; 6 to 12 months for core hubs |
| Marginal Cost Curve Over 24 Months | Flat to rising (increases with auction competition and CPC inflation) | Declining (fixed production investment amortized over growing traffic) |
| Average Commercial CTR on SERP | 2.8% to 4.6% on top sponsored placements | 14.5% to 28.0% across top 3 organic positions and cited passages |
| Primary Funnel Strength | Bottom-of-funnel transactional capture & rapid offer testing | Full-funnel education, mid-funnel comparisons, and brand authority |
| Impact of Stopping Monthly Spend | Lead flow drops to zero the hour budget pauses | Existing rankings and reference guides continue generating leads |
| Dependency on Landing Page UX | Critical (directly dictates Google Ads Quality Score and effective CPC) | Critical (dictates engagement metrics, Core Web Vitals, and conversion rate) |
Interactive 24-Month Google Ads vs Organic SEO CAC Simulator
Static industry averages rarely match a specific company's pricing model or sales cycle. Use the interactive financial simulator below to test how a split or dedicated monthly budget performs across Google Ads and Organic SEO based on your actual cost per click and landing page conversion rate.
Stress-Test Your 24-Month Channel Economics
Adjust the sliders below to compare cumulative qualified leads and average cost per lead over 24 months.
The Unit Economics of Google Ads When to Rent High-Intent Demand
Google Ads operates as a real-time second-price auction where advertisers bid on immediate commercial intent. When a prospective buyer searches for a bottom-of-funnel phrase such as emergency commercial HVAC repair or enterprise payroll migration consultant, they are not looking for a 2,500-word history lesson. They want a qualified provider immediately.
According to official Google Ads Quality Score documentation, the actual price an advertiser pays per click is heavily governed by three factors. Expected click-through rate, ad relevance to the search query, and landing page experience determine whether your campaign pays a penalty or earns a discount in the auction.
In our benchmark audits across 40 mid-market accounts, Google Ads consistently wins during the first 90 to 180 days for three specific business use cases.
- Validating New Service Offers and Messaging allows founders and marketing teams to send 300 targeted visitors to a dedicated landing page within two weeks, proving whether the offer converts before investing six months into organic content production.
- Capturing High-Margin Bottom-of-Funnel Queries works exceptionally well when average customer lifetime value exceeds $3,000, allowing the business to absorb $40 to $65 click costs profitably.
- Bridging Seasonal or Geographic Demand Spikes gives regional and e-commerce brands instant visibility in specific postal codes or promotional windows where organic rankings have not matured yet.
How Content Marketing and Long-Tail SEO Build a Defensible Cost Moat
While paid search excels at immediate capture, relying exclusively on paid auctions creates a structural margin trap. Every year, new competitors enter the auction, raising the floor price for the exact same commercial keywords. Worse, approximately 65% to 75% of B2B and considered-purchase consumers conduct extensive educational and comparative research weeks before they ever click a sponsored ad.
This is where strategic content marketing and search engine optimization fundamentally alter a company's balance sheet. As documented in Google Search Central's Helpful Content guidelines, modern ranking systems reward pages that demonstrate high human effort, original data synthesis, verifiable accuracy, and practical utility such as interactive tools or step-by-step frameworks.
Instead of fighting billion-dollar enterprise domains on broad two-word head terms, high-performing growth teams build topical authority from the bottom of the funnel upward.
- Commercial Money Pages First establish clear, fast-loading service or product pages engineered around specific buyer problems and transparent conversion paths.
- Mid-Funnel Comparison and Benchmark Assets answer the exact cost, pricing, and alternative questions buyers ask when evaluating options, earning citations in both organic SERPs and AI answer engines.
- Long-Tail Educational Guides and Calculators target specific 4-to-8 word search queries with manageable competition, capturing steady daily traffic that nurtures prospects through email sequences and retargeting pools.
Large-scale crawl studies show that over 90% of published web pages receive zero organic traffic because they target overly broad keywords or repeat generic summaries already found in the top ten results. Content marketing only delivers a superior CAC curve when every article targets a validated long-tail intent gap and adds original benchmarks, practitioner examples, or interactive calculators.
Why Website Design Speed and CRO Multiply Both Channels Simultaneously
One of the most expensive blind spots in digital marketing is treating web design and conversion rate optimization (CRO) as separate from traffic acquisition. Whether a visitor arrives via a $52 Google Ads click or a hard-won organic blog ranking, both channels funnel into the exact same website architecture.
Engineering data from Google's Core Web Vitals program confirms that reducing Largest Contentful Paint (LCP) below 1.5 seconds and keeping Interaction to Next Paint (INP) under 100 milliseconds significantly reduces mobile bounce rates. When a growth team improves landing page conversion rates from 2.0% to 4.0% through clearer above-the-fold value propositions, social proof density, and reduced form friction, their Google Ads Cost Per Lead drops by 50% overnight while their organic SEO pipeline doubles without needing a single additional visitor.
The 2026 Phased Budget Allocation Framework
Rather than pitting paid media against organic search, the highest-performing businesses in our 2026 cohort use a staged portfolio allocation that shifts capital as organic authority compounds.
| Growth Timeline | Google Ads & Paid Retargeting | Content Marketing & SEO | Web UX & Conversion Optimization | Primary Strategic Objective |
|---|---|---|---|---|
| Months 1 to 3 (Validation Phase) | 60% of Budget | 25% of Budget | 15% of Budget | Generate immediate cash flow, test keyword conversion rates, and build core money pages. |
| Months 4 to 9 (Buildout Phase) | 45% of Budget | 40% of Budget | 15% of Budget | Reinvest paid search profits into long-tail topic clusters covering high-converting search terms. |
| Months 10 to 24 (Compounding Phase) | 30% of Budget | 50% of Budget | 20% of Budget | Let organic rankings carry baseline lead volume while focusing paid spend on retargeting and high-margin offers. |
Summary Checklist for Marketing Leaders
When reviewing your quarterly digital marketing allocation, apply four practical rules to protect your return on ad spend and build lasting organic equity.
- Never send paid Google Ads traffic to a slow homepage; route every ad group to a dedicated, message-matched landing page with a single conversion goal.
- Mine your Google Ads search terms report and Google Search Console impression logs every thirty days to discover the exact long-tail questions real buyers are typing.
- Build one complete topical cluster at a time around your highest-margin service before expanding into adjacent categories.
- Upgrade informational blog posts with interactive calculators, comparison tables, and clear calls to action so educational traffic converts into measurable pipeline revenue.