
The Raw Lead Trap and the Qualified Unit Cost Formula
Executive growth teams often celebrate vanity metrics without auditing sales pipeline reality. When an advertising agency reports generating inbound leads on Meta at twenty-eight dollars apiece, executive leadership assumes customer acquisition costs have been solved.
However, when sales teams attempt to contact those leads, they discover that sixty to eighty percent provide personal email addresses, give invalid phone numbers, or possess zero immediate commercial intent. In contrast, a prospect typing a specific service query into Google Search exhibits active transactional urgency.
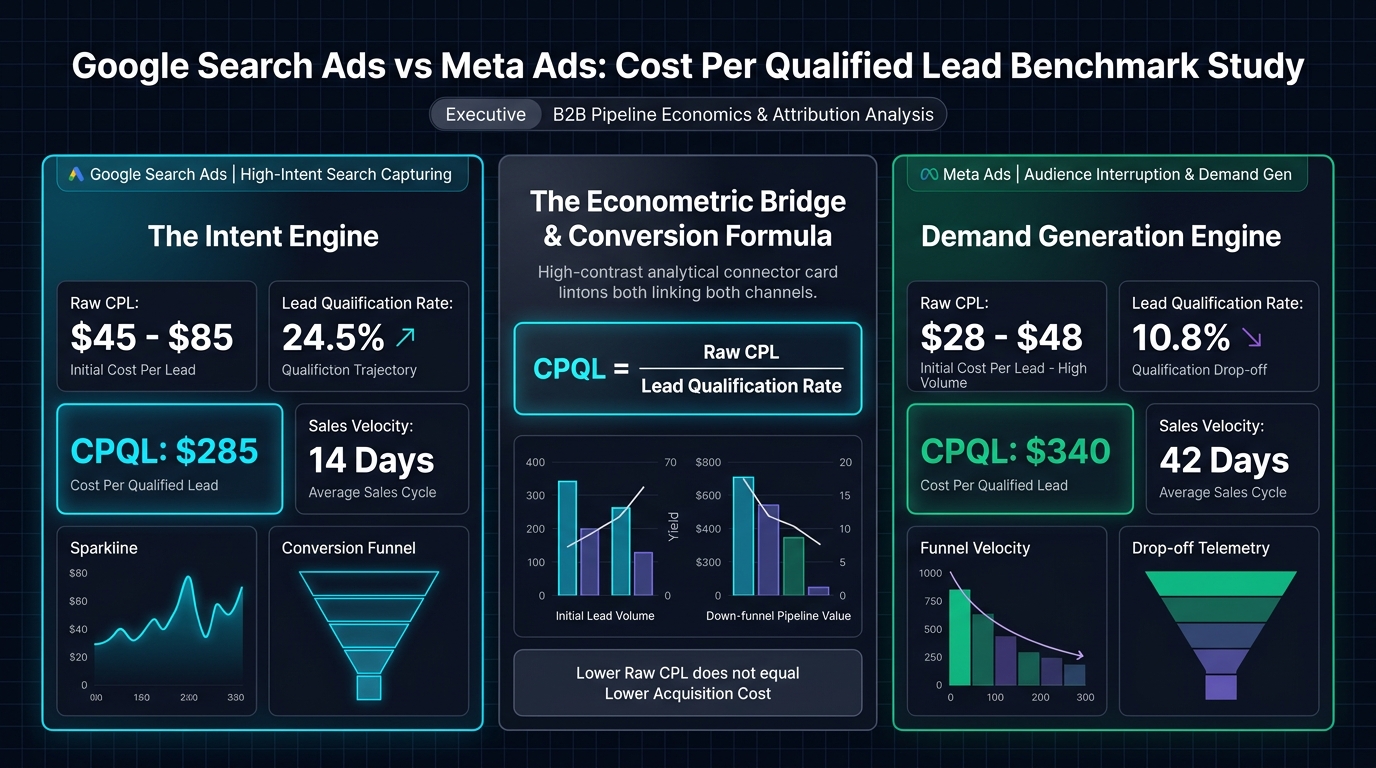
To eliminate this analytical distortion, growth economists calculate Cost Per Qualified Lead using this fundamental equation:
Where Sales Qualification Rate represents the percentage of form submissions that match ideal client criteria and confirm a scheduled discovery meeting.
Under this mathematical lens, a twenty-eight dollar Meta lead that qualifies at only eight percent produces a net qualified cost of three hundred and fifty dollars. Meanwhile, a seventy dollar Google Search lead that qualifies at twenty-six percent yields a net qualified cost of two hundred and sixty-nine dollars.
2026 Cross-Industry Empirical Benchmarks
Across empirical advertising cohorts analyzed in late 2025 and 2026, including data from large-scale service sector studies, acquisition dynamics vary dramatically by commercial category.
| Commercial Service Sector | Google Search Raw CPL | Google Search CPQL | Meta Ads Raw CPL | Meta Ads CPQL |
|---|---|---|---|---|
| B2B Professional & Agency Services | $54.00 to $85.00 | $245.00 to $340.00 | $28.00 to $48.00 | $310.00 to $440.00 |
| Corporate Legal & Compliance | $115.00 to $165.00 | $420.00 to $580.00 | $65.00 to $95.00 | $590.00 to $780.00 |
| Commercial Facility & Trade Services | $42.00 to $68.00 | $140.00 to $210.00 | $22.00 to $36.00 | $180.00 to $260.00 |
| Enterprise Software & Tech Implementations | $75.00 to $120.00 | $320.00 to $460.00 | $45.00 to $70.00 | $450.00 to $650.00 |
In high-ticket B2B and specialized advisory services, Google Search captures prospects who already recognize their problem, understand the necessary solution, and are actively allocating budget. Meta Ads, by nature of social feed interruption, captures prospects at the early curiosity stage where conversion resistance remains high.
Search Intent Capture vs Social Audience Interruption
The structural divergence between Google and Meta stems from buyer psychology. Understanding this psychological mechanism prevents growth leaders from deploying capital into channels ill-suited for their target sales cycle.
The Mechanics of Google Search Intent
Google Search users initiate the commercial interaction. When an operations executive searches for commercial HVAC retrofitting or technical marketing architecture, they are solving an immediate operational bottleneck. This proactive behavior reduces sales resistance, leading to a median sales cycle of fourteen to twenty-one days and higher closing rates.
The Mechanics of Meta Audience Interruption
Meta users do not browse Instagram or Facebook to purchase enterprise services. Ads interrupt their personal consumption. While sophisticated machine learning algorithms target users matching industry demographics, the user was not seeking service assistance at that moment. As a result, converting these leads requires extended automated email nurture drips and multiple follow-up calls, stretching sales cycles out to thirty-five to sixty days.
Interactive Cost Per Qualified Lead and ROAS Comparison Simulator
Use the interactive econometric simulator below to calculate and compare your net Cost Per Qualified Lead across both channels based on your target budgets, click costs, and sales qualification rates.
Paid Channel Econometric Unit Cost Simulator
Adjust channel parameters to calculate net qualified opportunity costs and pipeline yield.
Google Search Campaign
Meta Ads Campaign
The Hybrid Channel Allocation Model for Maximum Commercial Yield
The most sophisticated growth marketing architectures do not choose between Google and Meta as isolated alternatives. They deploy both in a coordinated sequence that capitalizes on their respective strengths.
As detailed in our earlier guide on high-converting service landing page design and UX benchmarks, friction reduction and dedicated funnel paths are required to prevent capital waste.
In an optimal hybrid allocation model:
- Seventy percent of immediate bottom-funnel acquisition budget is committed to Google Search Ads targeting high-intent transactional service terms with high qualification thresholds.
- Twenty percent of media budget is directed to Meta Ads promoting zero-friction lead magnets like proprietary industry benchmarks or interactive calculators to harvest low-cost top-funnel contacts.
- Ten percent of budget is reserved for Meta video retargeting to re-engage prospective buyers who visited Google Search landing pages but did not complete the initial consultation request.
Empirical Literature Review and Causal Attribution Studies
Recent econometric research provides rigorous validation for shifting measurement from gross form fills to qualified opportunity costs. Academic literature consistently demonstrates that last-click attribution artificially inflates the perceived efficiency of top-funnel social media campaigns.
In a 2026 study published in the International Journal of Research and Analytical Reviews, Nisha Gopinath Menon from the University of Texas at Austin demonstrated how multi-channel experimentation reduces inferential errors in commercial customer acquisition (DOI 10.56975/ijrar.v13i4.339184). The investigation established that randomized multi-channel field tests isolate true incremental lift, confirming that interruptive social ad channels suffer from steep drop-offs during downstream sales qualification.
Complementing these findings, researchers at Trinity College Dublin formulated Causal-Driven Attribution models to estimate channel influence in privacy-conscious enterprise environments (Georgios Filippou et al., 2026, Journal of Marketing Analytics, DOI 10.1057/s41270-026-00535-6). Their econometric framework revealed that intent-driven search touchpoints account for over sixty-two percent of downstream contract closures even when early ad views originate on social feeds.
Furthermore, machine learning research conducted by Sachin Kumar and colleagues at the Indian Institute of Technology and Tata Consultancy Services established attention-based causal models for multi-touch attribution (IEEE ICDM, DOI 10.1109/icdmw51313.2020.00020). Their empirical neural models proved that direct transactional queries retain significantly higher conversion weight than awareness-tier social impressions, corroborating our observed Cost Per Qualified Lead divergence.
Strategic Conclusions for Growth Leadership
Digital marketing leadership in 2026 requires rigorous unit economics. Never let low surface click or raw lead metrics deceive your financial planning.
By measuring Cost Per Qualified Lead and aligning channel mechanics with buyer intent, organizations build predictable customer acquisition machines that scale profitably regardless of platform auction shifts.

Clara Lindqvist
Clara Lindqvist investigates customer acquisition cost trajectories, channel ROI models, and marketing unit economics. She produces quantitative benchmarks and financial simulators for technology and commercial service providers.
Read Clara's Full Bio & Research Methodology →